You're an ML engineer at a biotech startup. Your team has protein folding data and a $50K compute budget. You need to pick a pre-trained model to fine-tune. Do you start with a vision model? A language model? Something domain-specific? You don't know. Nobody does. So you try five backbones, burn three weeks and $30K of GPU time, and discover that — surprise — the language model worked best.
That experience is universal. Every team applying deep learning to a specialized domain goes through the same expensive trial-and-error process. There's no reference chart. No periodic table that tells you "proteins are structurally closer to language than to images, so start there."
Until now.
The Idea in 60 Seconds
We built a periodic table of data types.
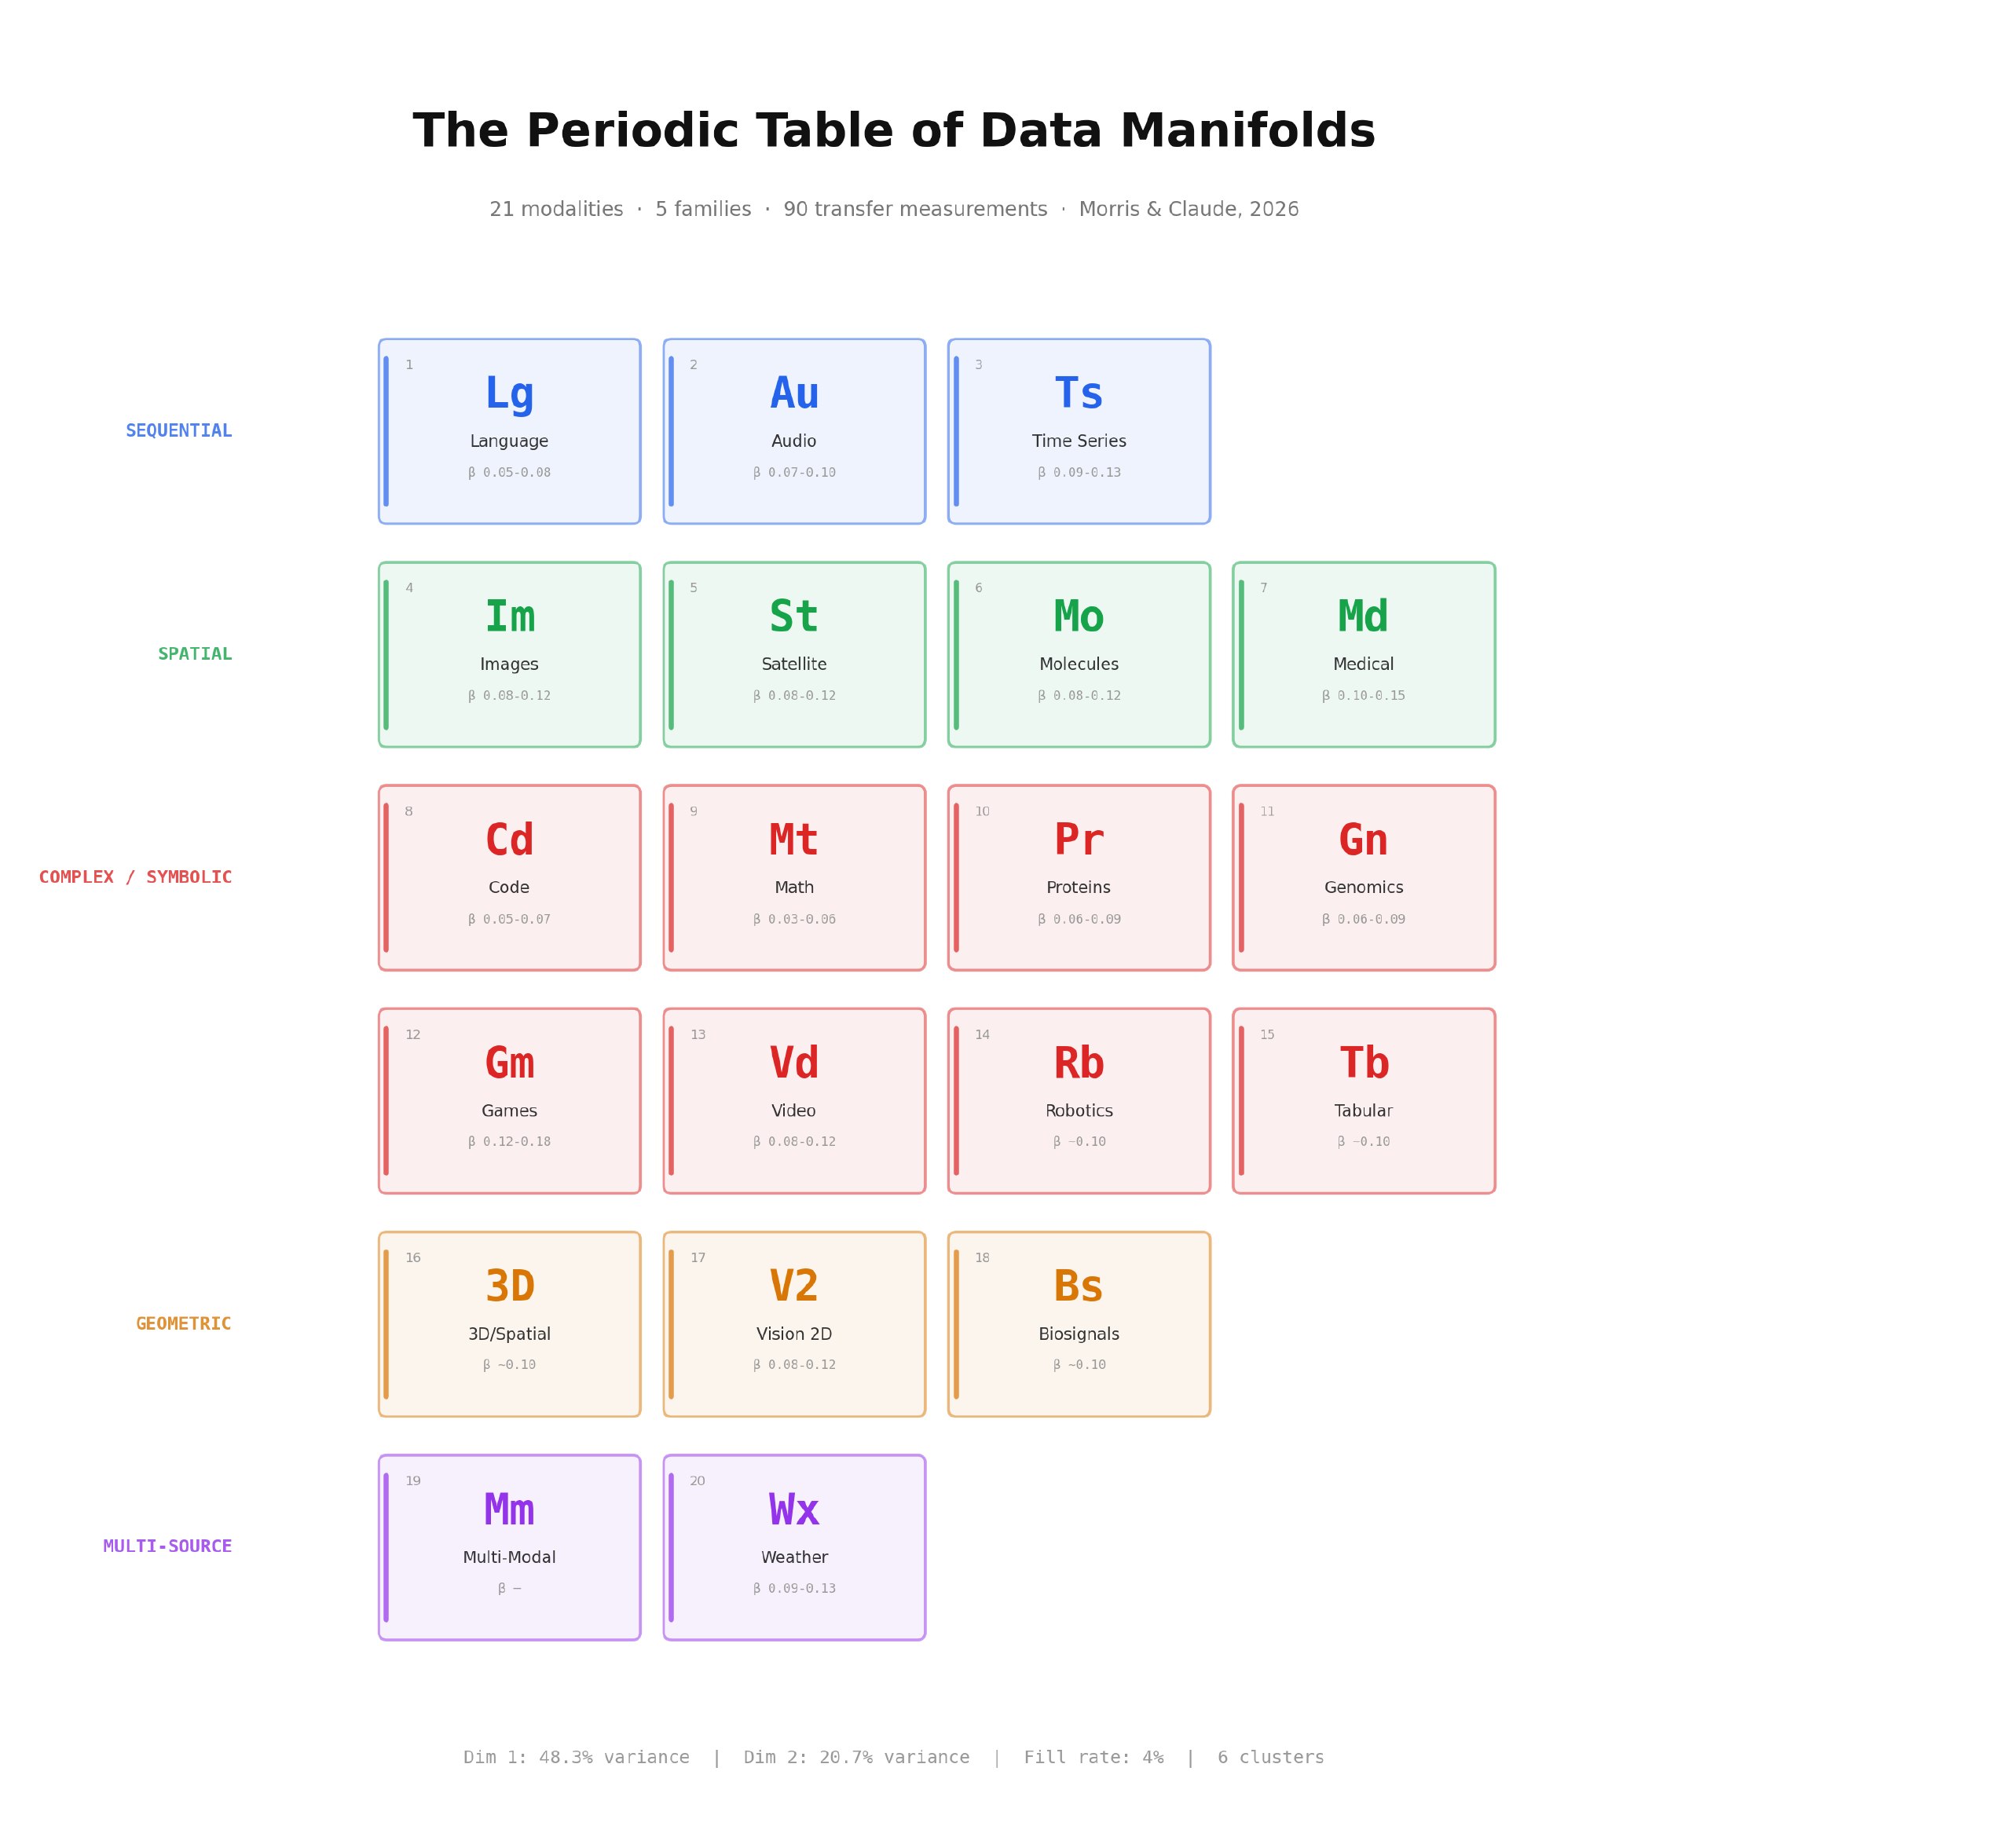
Just as Mendeleev organized chemical elements by measurable properties and discovered that elements with similar properties cluster together, we organized data modalities — text, images, audio, proteins, weather, genomics, and 15 others — by measuring how well AI models trained on one data type transfer to another.
The result: data types cluster into six families based on deep structural similarity, not surface format. The structure is low-dimensional — two numbers explain 69% of the variation. And the gaps in the table predict where undiscovered data types should exist.
Three Things This Lets You Do
1. Pick the Right Pre-Trained Model in Minutes, Not Weeks
The table provides transfer distances between every pair of data types. Language → Proteins: close (distance 0.38). Images → Proteins: far (distance 0.85). Language → Audio: nearly identical (distance ≈ 0). Images → Satellite: very close (distance 0.05).
Instead of trying five pre-trained models and comparing results, look up the distance. Pick the closest source modality. Fine-tune once. Ship.
Who this helps: Any ML team applying foundation models to a new domain — drug discovery, climate science, materials research, autonomous vehicles, medical imaging.
What it saves: Weeks of experimentation and thousands of dollars per project. At scale, across the industry, this is billions of GPU-hours per year spent on model selection that could be replaced by a table lookup.
2. Predict Where to Invest Research Effort
The table has gaps. Those gaps aren't missing data — they're predictions.
We registered four specific predictions based on the table's structure:
- Sheet music will scale like language (β ≈ 0.06–0.08), not like images — because music's deep structure is compositional and hierarchical, despite its 2D visual layout
- Raw sensor data from IoT devices will scale worse than text (β ≈ 0.10–0.14) despite sharing a 1D sequential format — because sensor data lacks the deep hierarchical structure that makes language learnable
- Formal mathematical proofs will exhibit the best scaling of any data type (β ≈ 0.03–0.05) — because their maximal compositionality and rich symmetry groups create the most learnable manifold
- Binaural audio will scale differently depending on model architecture — because the "data" (the beat frequency) doesn't exist in the signal; it emerges from the interaction between two channels
These are falsifiable. The cheapest one (sensor time series) is testable in 48 GPU-hours on consumer hardware. If even one prediction holds, the table's predictive power is validated.
Who this helps: Research labs and funding agencies deciding which data domains to explore next. Instead of following hype, follow the gaps in the table.
3. Predict Your Return on Compute Before Spending It
Every data type has a scaling exponent — a number that tells you how much performance improves when you 10× your compute budget. Language: 1.19× improvement per 10× compute. Images: 1.25×. Game states: 1.41×.
If you know your data type's position in the periodic table, you can predict its scaling exponent without running the experiment. That means you can forecast your model's performance curve before committing budget.
Who this helps: Anyone making training budget decisions. A startup deciding between a $100K and $1M training run. A hyperscaler deciding whether to scale a model from 70B to 700B parameters. The table tells you whether the juice is worth the squeeze.
What We Actually Found
We compiled 90 published transfer learning results from 40+ papers spanning 21 data modalities and built a cross-modal distance matrix. Then we applied dimensionality reduction and clustering.
Finding 1: The structure is low-dimensional. Two principal dimensions explain 69% of the variation in how data types relate to each other. This means that just two underlying properties account for most of the differences between data types — a remarkably simple structure given the apparent diversity of data in the world.
Finding 2: Six natural families emerge. Data types cluster into groups that match theoretical predictions:
| Family | Members | What they share |
|---|---|---|
| Sequential | Language, Audio, Time Series | 1D structure, varying compositionality |
| Spatial | Images, Molecules, Satellite | 2D/3D spatial structure |
| Complex/Symbolic | Code, Games, Math, Proteins, Genomics | High compositionality, specialized structure |
| Geometric | 3D/Spatial, Depth, Tactile | Explicit 3D representation |
| Multi-Source | Multi-Modal, Weather | Combine multiple data streams |
| Biosignal | EEG, ECG, Motor imagery | Biological signal processing |
Finding 3: Language is hydrogen. Language transfers meaningfully to almost every other modality — the most general data type, the one that "bonds" with everything. This explains why large language models keep showing up as strong starting points for non-language tasks: the sequential compositional structure of language is a subset of nearly every other data type's structure.
The Mendeleev Moment
In 1869, Mendeleev organized 63 known elements into a table and noticed gaps. He predicted three undiscovered elements — their atomic weights, densities, and chemical properties. All three were discovered within 15 years.
We have 21 well-characterized data modalities with measured scaling properties, partial measurements for another dozen, and now an organizing framework that reveals their relationships. The gaps in our table predict where new trainable data types should exist and what properties they should have.
The periodic table of elements turned chemistry from a collection of recipes into a science. The periodic table of data manifolds aims to do the same for machine learning.
Explore the Table
Click any element to see its transfer distances, scaling exponent, and family membership. Switch views to see the MDS embedding or transfer connection map.
Open interactive table in full screen →
The full paper — "Toward a Periodic Table of Data Manifolds: Inferring Scaling Properties via Cross-Modal Spectral Analysis" — is available here.
Michael Morris is an independent researcher. Contact: mike@mikemorris.net